COVID up 3 percent in Twin Cities wastewater, 9 Minn. counties high risk per CDC

Go Deeper.
Create an account or log in to save stories.
Like this?
Thanks for liking this story! We have added it to a list of your favorite stories.
A big logistical update this week: Minnesota Department of Health has begun releasing data on a weekly basis instead of daily. This change should not affect our Friday coverage too much, but we will no longer be updating our dashboard and data repository on a daily basis. You can expect updates to the COVID-19 in Minnesota key data page on Thursdays and Fridays, as well as the usual exploration of highlights here on Fridays.
As far as this week’s data, we continue to see this phase of COVID hanging around, with perhaps some hope in declining hospitalizations. Nonetheless, after a brief lull, high CDC risk ratings are back in (at least) nine counties. And we have some details about traffic fatalities, which have increased in the pandemic nationwide and went up sharply in Minnesota in 2021. A survey from AAA provides one possible explanation
Indeterminate wave continues
Statewide hospitalizations from COVID-19 are down from a couple of weeks ago. Non-ICU admissions were the first to begin their decline, and in more recent days ICU admissions have also fallen. Although non-ICU admissions have leveled off in recent days, we haven’t seen a major increase, so it could be a sign of a more sustained waning in the works.

Deaths have increased some in the last week, but continue to oscillate around the five-six deaths per day mark as they have since mid-May. The past two Julys have had relatively fewer deaths compared to other months, so we’ll see if that’s a trend that (hopefully!) continues this year.
Turn Up Your Support
MPR News helps you turn down the noise and build shared understanding. Turn up your support for this public resource and keep trusted journalism accessible to all.

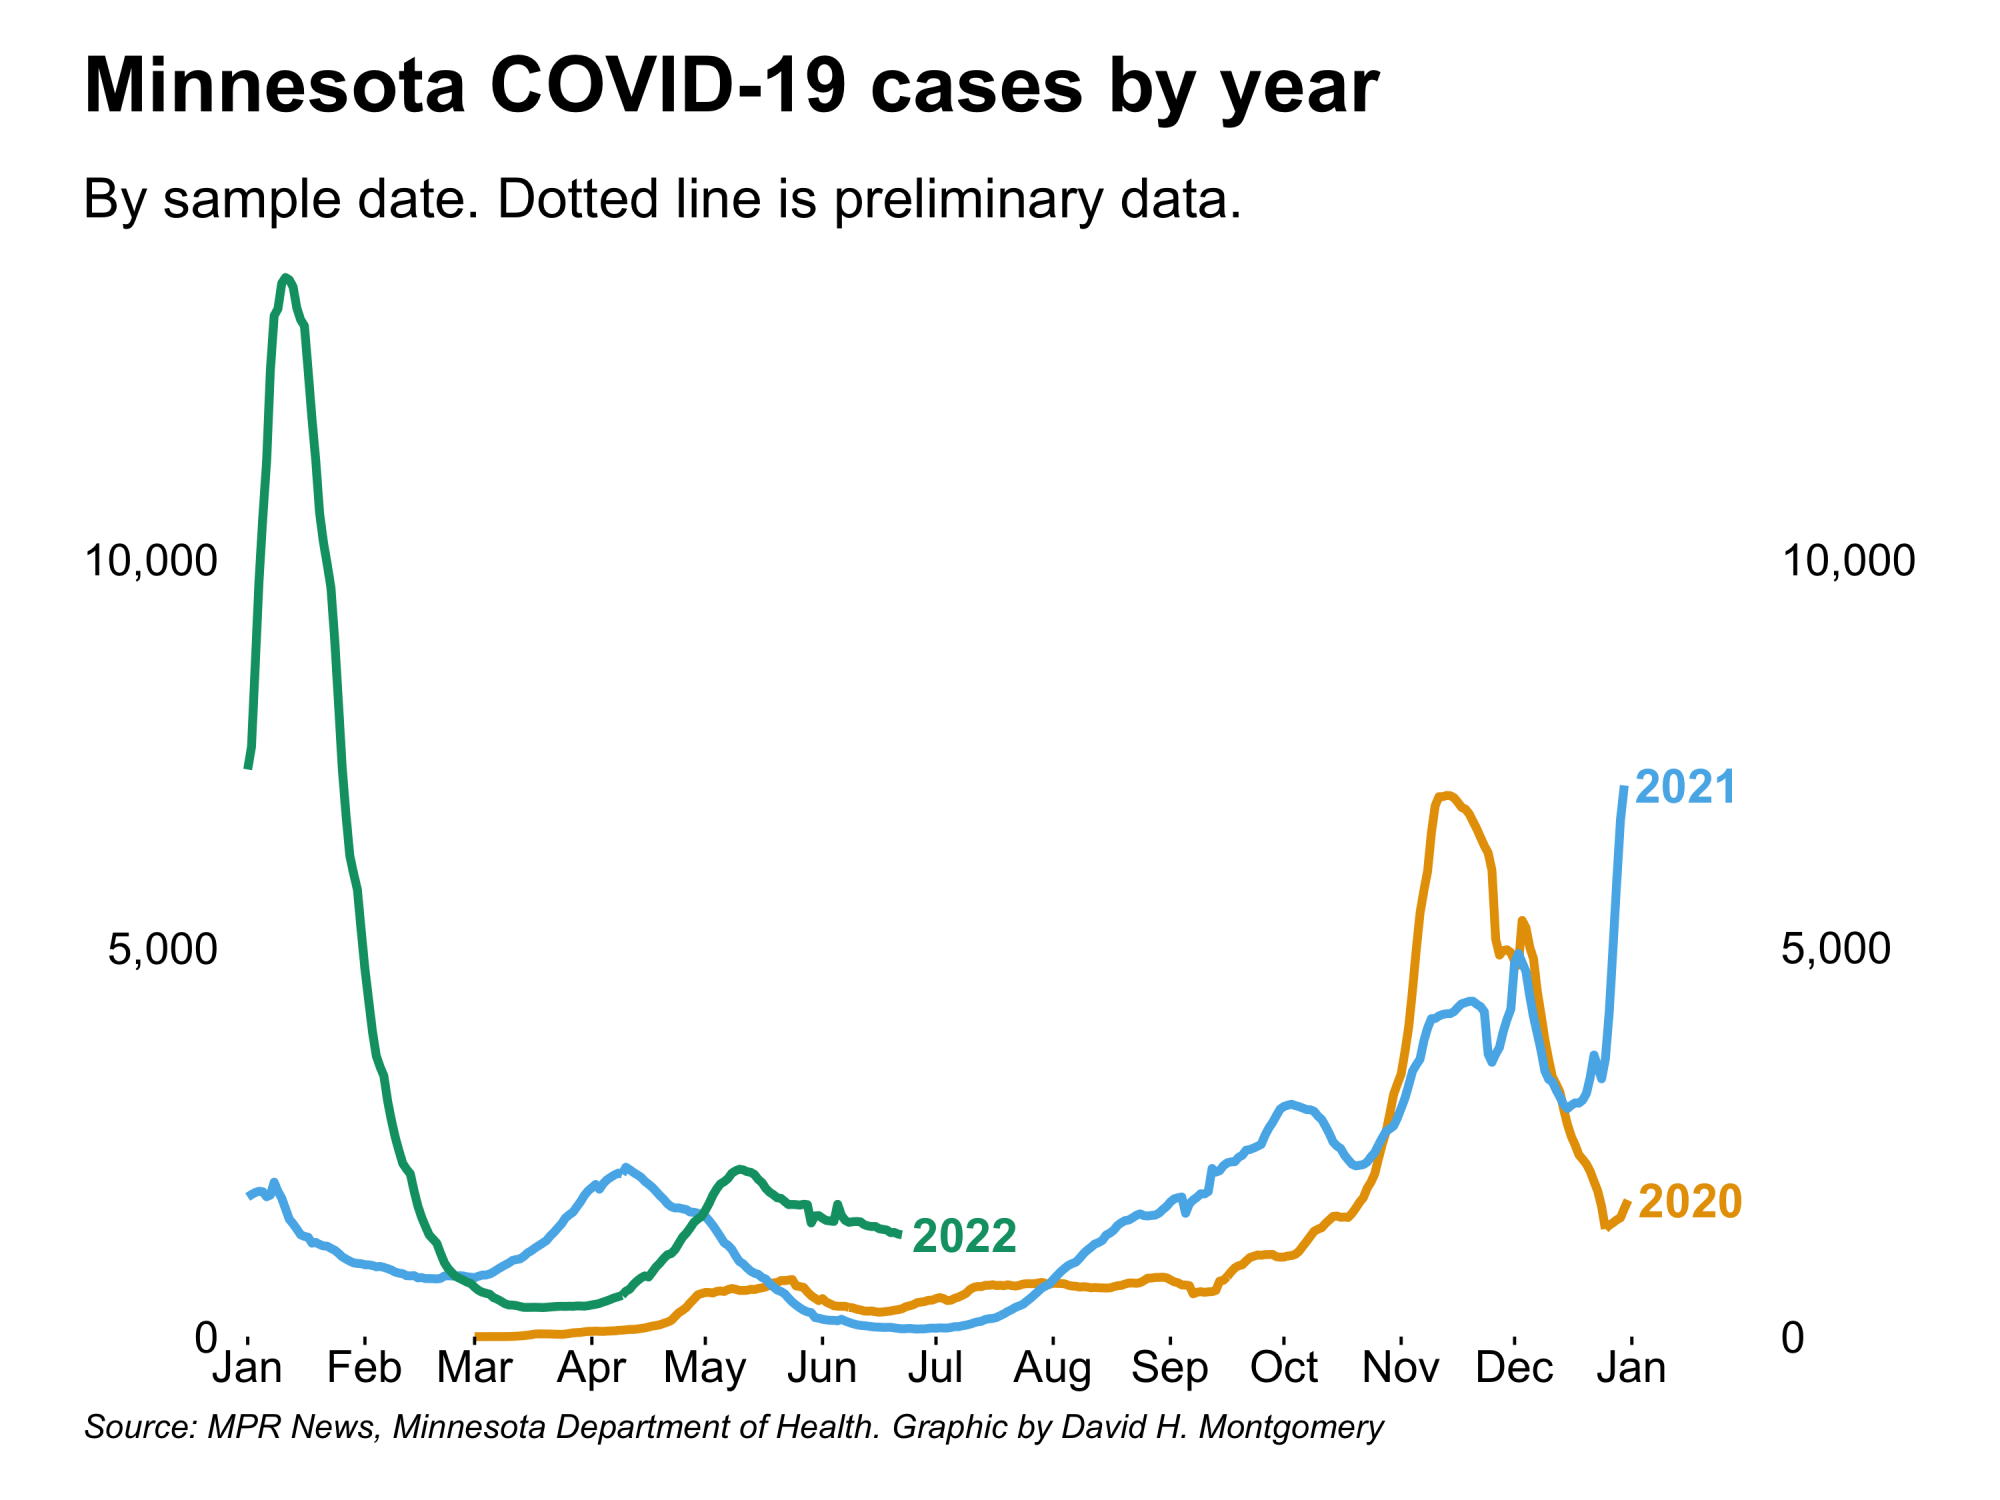
Cases continue inching their way down but given the prevalence of at-home testing it’s best not to rely on this data too much, especially when the trend is so small. Continue reading for data from wastewater samples, which may better indicate recent trends of COVID spread.

On the vaccine front, more of the youngest Minnesotans have been vaccinated. Last week 0.4 percent of those aged six months to four years had been vaccinated. That portion increased nearly sixfold this week, with 2.3 percent of young children now having received one dose.

Wastewater: COVID-19 levels mostly level
Today’s weekly missive from the Metropolitan Council and University of Minnesota’s Genomic Center indicates that COVID-19 levels measured in the state’s largest wastewater treatment plant are showing a minor three percent increase this week over last.
They also note that “omicron subvariant BA.5 is now the dominant variant in Metro Plant wastewater” constituting 43 percent of the SARS-CoV-2 RNA that they sequenced.

The more regionally comprehensive wastewater tracking project at the University of Minnesota’s Medical School shows both monthly and weekly declines in samples taken from plants in the Twin Cities Metro as well as south east Minnesota.
Unfortunately, this update confirms last week’s preliminary data which warned of increased levels of COVID-19 in measurements taken from plants in South Central and especially the North West regions.
CDC: 9 counties rated with high community level risk; 75 with high COVID-19 transmission
Last week we noted the first CDC map that lacked a single county in orange, indicating a high “Community Level” risk. This is no longer the case. Nine counties now show up as orange in the CDC’s map, including Rock in the state’s extreme southwest and Cook in our extreme northeast. Also included: St. Louis and Olmsted counties, home to Duluth and Rochester.
The CDC recommends that those living in areas with high community level risk should wear masks indoors. Counties rated as medium—this week including most of the Twin Cities and St. Cloud areas as well as most of the state’s southern border—should consult with their health care providers about wearing masks and taking other precautions.
The CDC also provides a COVID-19 risk assessment based only on known COVID-19 case rates (the “community level” ratings combine case rates with hospital admission rates). Their Community Transmission assessment is consistently scarier looking. Currently 87 percent of the nation’s counties are at or above the “high” transmission risk threshold of 100 or more cases per 100,000 over the course of a week. This includes 75 of Minnesota’s 87 counties.
Cook County currently tops the list of the state’s highest weekly case rate, at 329 per 100,000. Pope and Lac qui Parle counties, both in west central Minnesota, also exceed 300. Only three of the state’s counties have rates below 50: Kittson, Norman and Red Lake.
Traffic fatalities have increased in pandemic
Data from the National Safety Council indicates Minnesota had the second-highest increase in the U.S. of traffic fatalities between 2020 and 2021. This unfortunate data point sits amongst a larger trend of increased traffic fatalities nationwide during the pandemic, following decades of gains in decreasing fatalities, including in Minnesota.
A nationwide survey from the AAA Foundation for Traffic Safety provides one possible explanation for the increase: the share of risk-taking drivers on the road has gone up, while the share of safer drivers has gone down. This is according to self-reported data.

On a positive note, this year is so far going better than last year for Minnesota traffic fatalities. The National Safety Council’s data is available through April and shows that while January and February were close to 2021’s numbers, March and April were down 30 percent from last year.


