");vwo_$('head').append(_vwo_sel);return vwo_$('head')[0] && vwo_$('head')[0].lastChild;})("HEAD")}}, R_940895_48_1_2_0:{ fn:function(log,nonce=''){return (function(x) { if(!vwo_$.fn.vwoRevertHtml){ return; }; var ctx=vwo_$(x),el; /*vwo_debug log("Revert","content",""); vwo_debug*/; el=vwo_$('[vwo-element-id="1742919897117"]'); el.revertContentOp().remove();})("HEAD")}}, C_940895_48_1_2_1:{ fn:function(log,nonce=''){return (function(x) {var el,ctx=vwo_$(x); /*vwo_debug log("editElement",".stylingblock-content-margin-cell > table:nth-of-type(1) > tbody:nth-of-type(1) > tr:nth-of-type(1) > td:nth-of-type(1) > div:nth-of-type(1) > div:nth-of-type(1) > h2:nth-of-type(1) > span:nth-of-type(1)"); vwo_debug*/(el=vwo_$(".stylingblock-content-margin-cell > table:nth-of-type(1) > tbody:nth-of-type(1) > tr:nth-of-type(1) > td:nth-of-type(1) > div:nth-of-type(1) > div:nth-of-type(1) > h2:nth-of-type(1) > span:nth-of-type(1)")).html("Hello! David Brancaccio here. Do you want instant access to the free online course - “Economics 101” - to understand basic economic concepts?");})(".stylingblock-content-margin-cell > table:nth-of-type(1) > tbody:nth-of-type(1) > tr:nth-of-type(1) > td:nth-of-type(1) > div:nth-of-type(1) > div:nth-of-type(1) > h2:nth-of-type(1) > span:nth-of-type(1)")}}, R_940895_48_1_2_1:{ fn:function(log,nonce=''){return (function(x) { if(!vwo_$.fn.vwoRevertHtml){ return; }; var el,ctx=vwo_$(x); /*vwo_debug log("Revert","editElement",".stylingblock-content-margin-cell > table:nth-of-type(1) > tbody:nth-of-type(1) > tr:nth-of-type(1) > td:nth-of-type(1) > div:nth-of-type(1) > div:nth-of-type(1) > h2:nth-of-type(1) > span:nth-of-type(1)"); vwo_debug*/(el=vwo_$(".stylingblock-content-margin-cell > table:nth-of-type(1) > tbody:nth-of-type(1) > tr:nth-of-type(1) > td:nth-of-type(1) > div:nth-of-type(1) > div:nth-of-type(1) > h2:nth-of-type(1) > span:nth-of-type(1)")).vwoRevertHtml();})(".stylingblock-content-margin-cell > table:nth-of-type(1) > tbody:nth-of-type(1) > tr:nth-of-type(1) > td:nth-of-type(1) > div:nth-of-type(1) > div:nth-of-type(1) > h2:nth-of-type(1) > span:nth-of-type(1)")}}, C_940895_48_1_2_2:{ fn:function(log,nonce=''){return (function(x) {var el,ctx=vwo_$(x); /*vwo_debug log("content","[vwo-element-id='1742482566780']"); vwo_debug*/(el=vwo_$("[vwo-element-id='1742482566780']")).replaceWith2("You'll gain real-world insights into how economics impacts your daily life with this easy-to-follow online course. This crash course is based on the acclaimed textbook Economy, Society, and Public Policy by CORE Econ, tailored to help you grasp key concepts without feeling overwhelmed.

Whether you're new to economics or just want to deepen your understanding, this course covers the basics and connects them to today’s pressing issues—from inequality to public policy decisions.

Each week, you'll receive a reading guide that distills core principles, offers actionable takeaways, and explains how they affect the current world. While the full ebook enriches the experience, the guides alone provide a comprehensive understanding of fundamental economic ideas.

You’ll find this course especially useful and unique because…
"),el=vwo_$("[vwo-element-id='1742482566780']");})("[vwo-element-id='1742482566780']")}}, R_940895_48_1_2_2:{ fn:function(log,nonce=''){return (function(x) { if(!vwo_$.fn.vwoRevertHtml){ return; }; var el,ctx=vwo_$(x); /*vwo_debug log("Revert","content","[vwo-element-id='1742482566780']"); vwo_debug*/(el=vwo_$("[vwo-element-id='1742482566780']")).revertContentOp(),el=vwo_$("[vwo-element-id='1742482566780']");})("[vwo-element-id='1742482566780']")}}},rules:[{"triggers":["12454059"],"tags":[{"data":{"type":"g","campaigns":[{"c":39,"g":6}]},"id":"metric","metricId":0}]},{"triggers":["12454053"],"tags":[{"data":"campaigns.39","priority":4,"id":"runCampaign"}]},{"triggers":["12454062"],"tags":[{"data":{"type":"g","campaigns":[{"c":39,"g":7}]},"id":"metric","metricId":0}]},{"triggers":["8536409"],"tags":[{"data":{"type":"m","campaigns":[{"c":48,"g":5}]},"id":"metric","metricId":959027},{"data":{"type":"m","campaigns":[{"c":61,"g":4}]},"id":"metric","metricId":959027},{"data":{"type":"m","campaigns":[{"c":62,"g":3}]},"id":"metric","metricId":959027},{"data":{"type":"m","campaigns":[{"c":63,"g":4}]},"id":"metric","metricId":959027},{"data":{"type":"m","campaigns":[{"c":16,"g":1}]},"id":"metric","metricId":959027},{"data":{"type":"m","campaigns":[{"c":55,"g":4}]},"id":"metric","metricId":959027},{"data":{"type":"m","campaigns":[{"c":64,"g":4}]},"id":"metric","metricId":959027},{"data":{"type":"m","campaigns":[{"c":54,"g":4}]},"id":"metric","metricId":959027},{"data":{"type":"m","campaigns":[{"c":39,"g":3}]},"id":"metric","metricId":959027}]},{"triggers":["10589191"],"tags":[{"data":"campaigns.48","priority":4,"id":"runCampaign"},{"data":"campaigns.61","priority":4,"id":"runCampaign"},{"data":"campaigns.62","priority":4,"id":"runCampaign"},{"data":"campaigns.63","priority":4,"id":"runCampaign"},{"data":"campaigns.16","priority":4,"id":"runCampaign"},{"data":"campaigns.55","priority":4,"id":"runCampaign"},{"data":"campaigns.64","priority":4,"id":"runCampaign"},{"data":"campaigns.54","priority":4,"id":"runCampaign"}]},{"triggers":["8536412"],"tags":[{"data":{"type":"m","campaigns":[{"c":48,"g":4}]},"id":"metric","metricId":959030},{"data":{"type":"m","campaigns":[{"c":61,"g":3}]},"id":"metric","metricId":959030},{"data":{"type":"m","campaigns":[{"c":62,"g":2}]},"id":"metric","metricId":959030},{"data":{"type":"m","campaigns":[{"c":63,"g":3}]},"id":"metric","metricId":959030},{"data":{"type":"m","campaigns":[{"c":16,"g":4}]},"id":"metric","metricId":959030},{"data":{"type":"m","campaigns":[{"c":55,"g":3}]},"id":"metric","metricId":959030},{"data":{"type":"m","campaigns":[{"c":64,"g":3}]},"id":"metric","metricId":959030},{"data":{"type":"m","campaigns":[{"c":54,"g":2}]},"id":"metric","metricId":959030},{"data":{"type":"m","campaigns":[{"c":39,"g":1}]},"id":"metric","metricId":959030}]},{"triggers":["8459768"],"tags":[{"data":{"type":"m","campaigns":[{"c":48,"g":2}]},"id":"metric","metricId":951905},{"data":{"type":"m","campaigns":[{"c":61,"g":5}]},"id":"metric","metricId":951905},{"data":{"type":"m","campaigns":[{"c":62,"g":5}]},"id":"metric","metricId":951905},{"data":{"type":"m","campaigns":[{"c":63,"g":5}]},"id":"metric","metricId":951905},{"data":{"type":"m","campaigns":[{"c":16,"g":2}]},"id":"metric","metricId":951905},{"data":{"type":"m","campaigns":[{"c":55,"g":1}]},"id":"metric","metricId":951905},{"data":{"type":"m","campaigns":[{"c":64,"g":5}]},"id":"metric","metricId":951905},{"data":{"type":"m","campaigns":[{"c":54,"g":1}]},"id":"metric","metricId":951905},{"data":{"type":"m","campaigns":[{"c":39,"g":4}]},"id":"metric","metricId":951905}]},{"triggers":["12639747"],"tags":[{"data":{"type":"g","campaigns":[{"c":16,"g":5}]},"id":"metric","metricId":0}]},{"triggers":["8639604"],"tags":[{"data":{"type":"m","campaigns":[{"c":48,"g":1}]},"id":"metric","metricId":951908},{"data":{"type":"m","campaigns":[{"c":61,"g":1}]},"id":"metric","metricId":951908},{"data":{"type":"m","campaigns":[{"c":62,"g":4}]},"id":"metric","metricId":951908},{"data":{"type":"m","campaigns":[{"c":63,"g":1}]},"id":"metric","metricId":951908},{"data":{"type":"m","campaigns":[{"c":16,"g":6}]},"id":"metric","metricId":951908},{"data":{"type":"m","campaigns":[{"c":55,"g":5}]},"id":"metric","metricId":951908},{"data":{"type":"m","campaigns":[{"c":64,"g":1}]},"id":"metric","metricId":951908},{"data":{"type":"m","campaigns":[{"c":54,"g":5}]},"id":"metric","metricId":951908}]},{"triggers":["12454056"],"tags":[{"data":{"type":"g","campaigns":[{"c":39,"g":5}]},"id":"metric","metricId":0}]},{"triggers":["8536415"],"tags":[{"data":{"type":"m","campaigns":[{"c":48,"g":3}]},"id":"metric","metricId":959033},{"data":{"type":"m","campaigns":[{"c":61,"g":2}]},"id":"metric","metricId":959033},{"data":{"type":"m","campaigns":[{"c":62,"g":1}]},"id":"metric","metricId":959033},{"data":{"type":"m","campaigns":[{"c":63,"g":2}]},"id":"metric","metricId":959033},{"data":{"type":"m","campaigns":[{"c":16,"g":3}]},"id":"metric","metricId":959033},{"data":{"type":"m","campaigns":[{"c":55,"g":2}]},"id":"metric","metricId":959033},{"data":{"type":"m","campaigns":[{"c":64,"g":2}]},"id":"metric","metricId":959033},{"data":{"type":"m","campaigns":[{"c":54,"g":3}]},"id":"metric","metricId":959033},{"data":{"type":"m","campaigns":[{"c":39,"g":2}]},"id":"metric","metricId":959033}]},{"triggers":["5"],"tags":[{"id":"checkEnvironment"}]},{"triggers":["8"],"tags":[{"priority":3,"id":"prePostMutation"},{"priority":2,"id":"groupCampaigns"}]},{"triggers":["9"],"tags":[{"priority":2,"id":"visibilityService"}]},{"triggers":["2"],"tags":[{"id":"runTestCampaign"}]},{"triggers":["75"],"tags":[{"id":"urlChange"}]}],pages:{"ec":[{"1625289":{"inc":["o",["url","urlReg","(?i).*"]]}},{"2121531":{"inc":["o",["pg","eq","141375"]]}}],"pc":[{"141375":{"inc":["o",["url","urlReg","(?i)^https?\\:\\\/\\\/(w{3}\\.)?mprnews\\.org\\\/story.*"],["url","urlReg","(?i)^https?\\:\\\/\\\/(w{3}\\.)?mprnews\\.org\\\/episode.*"]]}}]},pagesEval:{"ec":[1625289,2121531],"pc":[141375]},stags:{}}})(); ;;var commonWrapper=function(argument){if(!argument){argument={valuesGetter:function(){return{}},valuesSetter:function(){},verifyData:function(){return{}}}}const getVisitorUuid=function(){if(window._vwo_acc_id>=1037725){return window.VWO&&window.VWO.get("visitor.id")}else{return window.VWO._&&window.VWO._.cookies&&window.VWO._.cookies.get("_vwo_uuid")}};var pollInterval=100;var timeout=6e4;return function(){var accountIntegrationSettings={};var _interval=null;function waitForAnalyticsVariables(){try{accountIntegrationSettings=argument.valuesGetter();accountIntegrationSettings.visitorUuid=getVisitorUuid()}catch(error){accountIntegrationSettings=undefined}if(accountIntegrationSettings&&argument.verifyData(accountIntegrationSettings)){argument.valuesSetter(accountIntegrationSettings);return 1}return 0}var currentTime=0;_interval=setInterval((function(){currentTime=currentTime||performance.now();var result=waitForAnalyticsVariables();if(result||performance.now()-currentTime>=timeout){clearInterval(_interval)}}),pollInterval)}}; var pushBasedCommonWrapper=function(argument){var firedCamp={};if(!argument){argument={integrationName:"",getExperimentList:function(){},accountSettings:function(){},pushData:function(){}}}return function(){window.VWO=window.VWO||[];const getVisitorUuid=function(){if(window._vwo_acc_id>=1037725){return window.VWO&&window.VWO.get("visitor.id")}else{return window.VWO._&&window.VWO._.cookies&&window.VWO._.cookies.get("_vwo_uuid")}};var sendDebugLogsOld=function(expId,variationId,errorType,user_type,data){try{var errorPayload={f:argument["integrationName"]||"",a:window._vwo_acc_id,url:window.location.href,exp:expId,v:variationId,vwo_uuid:getVisitorUuid(),user_type:user_type};if(errorType=="initIntegrationCallback"){errorPayload["log_type"]="initIntegrationCallback";errorPayload["data"]=JSON.stringify(data||"")}else if(errorType=="timeout"){errorPayload["timeout"]=true}if(window.VWO._.customError){window.VWO._.customError({msg:"integration debug",url:window.location.href,lineno:"",colno:"",source:JSON.stringify(errorPayload)})}}catch(e){window.VWO._.customError&&window.VWO._.customError({msg:"integration debug failed",url:"",lineno:"",colno:"",source:""})}};var sendDebugLogs=function(expId,variationId,errorType,user_type){var eventName="vwo_debugLogs";var eventPayload={};try{eventPayload={intName:argument["integrationName"]||"",varId:variationId,expId:expId,type:errorType,vwo_uuid:getVisitorUuid(),user_type:user_type};if(window.VWO._.event){window.VWO._.event(eventName,eventPayload,{enableLogs:1})}}catch(e){eventPayload={msg:"integration event log failed",url:window.location.href};window.VWO._.event&&window.VWO._.event(eventName,eventPayload)}};const callbackFn=function(data){if(!data)return;var expId=data[1],variationId=data[2],repeated=data[0],singleCall=0,debug=0;var experimentList=argument.getExperimentList();var integrationName=argument["integrationName"]||"vwo";if(typeof argument.accountSettings==="function"){var accountSettings=argument.accountSettings();if(accountSettings){singleCall=accountSettings["singleCall"];debug=accountSettings["debug"]}}if(debug){sendDebugLogs(expId,variationId,"intCallTriggered",repeated)}if(singleCall&&(repeated==="vS"||repeated==="vSS")||firedCamp[expId]){return}window.expList=window.expList||{};var expList=window.expList[integrationName]=window.expList[integrationName]||[];if(expId&&variationId&&["VISUAL_AB","VISUAL","SPLIT_URL"].indexOf(_vwo_exp[expId].type)>-1){if(experimentList.indexOf(+expId)!==-1){firedCamp[expId]=variationId;var visitorUuid=getVisitorUuid();var pollInterval=100;var currentTime=0;var timeout=6e4;var user_type=_vwo_exp[expId].exec?"vwo-retry":"vwo-new";var interval=setInterval((function(){if(expList.indexOf(expId)!==-1){clearInterval(interval);return}currentTime=currentTime||performance.now();var toClearInterval=argument.pushData(expId,variationId,visitorUuid);if(debug&&toClearInterval){sendDebugLogsOld(expId,variationId,"",user_type);sendDebugLogs(expId,variationId,"intDataPushed",user_type)}var isTimeout=performance.now()-currentTime>=timeout;if(isTimeout&&debug){sendDebugLogsOld(expId,variationId,"timeout",user_type);sendDebugLogs(expId,variationId,"intTimeout",user_type)}if(toClearInterval||isTimeout){clearInterval(interval)}if(toClearInterval){window.expList[integrationName].push(expId)}}),pollInterval||100)}}};window.VWO.push(["onVariationApplied",callbackFn]);window.VWO.push(["onVariationShownSent",callbackFn])}}; var surveyDataCommonWrapper=function(argument){if(!argument){argument={getCampaignList:function(){return[]},surveyStatusChange:function(){},answerSubmitted:function(){}}}return function(){window.VWO=window.VWO||[];function getValuesFromAnswers(answers){var values=[];for(var i=0;i=timeout;if(toClearInterval||isTimeout){clearInterval(interval)}}),pollInterval)}}window.VWO.push(["onSurveyShown",function(data){commonSurveyCallback(data,argument.surveyStatusChange,"surveyShown")}]);window.VWO.push(["onSurveyCompleted",function(data){commonSurveyCallback(data,argument.surveyStatusChange,"surveyCompleted")}]);window.VWO.push(["onSurveyAnswerSubmitted",function(data){commonSurveyCallback(data,argument.answerSubmitted,"surveySubmitted")}])}}; (function(){var VWOOmniTemp={};window.VWOOmni=window.VWOOmni||{};for(var key in VWOOmniTemp)Object.prototype.hasOwnProperty.call(VWOOmniTemp,key)&&(window.VWOOmni[key]=VWOOmniTemp[key]);;})();(function(){window.VWO=window.VWO||[];var pollInterval=100;var _vis_data={};var intervalObj={};var analyticsTimerObj={};var experimentListObj={};window.VWO.push(["onVariationApplied",function(data){if(!data){return}var expId=data[1],variationId=data[2];if(expId&&variationId&&["VISUAL_AB","VISUAL","SPLIT_URL"].indexOf(window._vwo_exp[expId].type)>-1){}}])})();; ;var vD=VWO.data||{};VWO.data={content:{"fns":{"list":{"args":{"1":{}},"vn":1}}},as:"r5.visualwebsiteoptimizer.com",dacdnUrl:"https://dev.visualwebsiteoptimizer.com",accountJSInfo:{"ts":1743568225,"noSS":false,"pc":{"a":0,"t":0},"rp":30}};for(var k in vD){VWO.data[k]=vD[k]};;var gcpfb=function(a,loadFunc,status,err,success){function vwoErr() {_vwo_err({message:"Google_Cdn failing for " + a + ". Trying Fallback..",code:"cloudcdnerr",status:status});} if(a.indexOf("/cdn/")!==-1){loadFunc(a.replace("cdn/",""),err,success); vwoErr(); return true;} else if(a.indexOf("/dcdn/")!==-1&&a.indexOf("evad.js") !== -1){loadFunc(a.replace("dcdn/",""),err,success); vwoErr(); return true;}};window.VWO=window.VWO || [];window.VWO._= window.VWO._ || {};window.VWO._.gcpfb=gcpfb;;var d={cookie:document.cookie,URL:document.URL,referrer:document.referrer};var w={VWO:{_:{}},location:{href:window.location.href,search:window.location.search},_vwoCc:window._vwoCc};;window._vwo_cdn="https://dev.visualwebsiteoptimizer.com/cdn/";window._vwo_apm_debug_cdn="https://dev.visualwebsiteoptimizer.com/cdn/";window.VWO._.useCdn=true;window.vwo_eT="br";window._VWO=window._VWO||{};window._VWO.fSeg={};window._VWO.dcdnUrl="/dcdn/settings.js";window.VWO.sTs=1743522714;window._VWO._vis_nc_lib=window._vwo_cdn+"edrv/nc-027330777ece73059cc92c6141e45cb3br.js";var loadWorker=function(url){_vwo_code.load(url, { dSC: true, onloadCb: function(xhr,a){window._vwo_wt_l=true;if(xhr.status===200 ||xhr.status===304){var code="var window="+JSON.stringify(w)+",document="+JSON.stringify(d)+";window.document=document;"+xhr.responseText;var blob=new Blob([code||"throw new Error('code not found!');"],{type:"application/javascript"}),url=URL.createObjectURL(blob);window.mainThread={webWorker:new Worker(url)};window.vwoChannelFW=new MessageChannel();window.vwoChannelToW=new MessageChannel();window.mainThread.webWorker.postMessage({vwoChannelToW:vwoChannelToW.port1,vwoChannelFW:vwoChannelFW.port2},[vwoChannelToW.port1, vwoChannelFW.port2]);if(!window._vwo_mt_f)return window._vwo_wt_f=true;_vwo_code.addScript({text:window._vwo_mt_f});delete window._vwo_mt_f}else{if(gcpfb(a,loadWorker,xhr.status)){return;}_vwo_code.finish("&e=loading_failure:"+a)}}, onerrorCb: function(a){if(gcpfb(a,loadWorker)){return;}window._vwo_wt_l=true;_vwo_code.finish("&e=loading_failure:"+a);}})};loadWorker("https://dev.visualwebsiteoptimizer.com/cdn/edrv/worker-1135852b6bc11a94eb64017a8d120ad8br.js");;var _vis_opt_file;var _vis_opt_lib;if(window.VWO._.allSettings.dataStore.previewExtraSettings!=undefined&&window.VWO._.allSettings.dataStore.previewExtraSettings.isSurveyPreviewMode){var surveyHash=window.VWO._.allSettings.dataStore.plugins.LIBINFO.SURVEY_DEBUG_EVENTS.HASH;var param1="evad.js?va=";var param2="&d=debugger_new";var param3="&sp=1&a=940895&sh="+surveyHash;_vis_opt_file=vwoCode.use_existing_jquery&&typeof vwoCode.use_existing_jquery()!=="undefined"?vwoCode.use_existing_jquery()?param1+"vanj"+param2:param1+"va_gq"+param2:param1+"edrv/va_gq-3adf809ea7b0629d1cfde6b0f4969635br.js"+param2;_vis_opt_file=_vis_opt_file+param3;_vis_opt_lib="https://dev.visualwebsiteoptimizer.com/dcdn/"+_vis_opt_file}else if(window.VWO._.allSettings.dataStore.mode!=undefined&&window.VWO._.allSettings.dataStore.mode=="PREVIEW"){ var path1 = 'edrv/pd_'; var path2 = window.VWO._.allSettings.dataStore.plugins.LIBINFO.EVAD.HASH + ".js"; ;_vis_opt_file=vwoCode.use_existing_jquery&&typeof vwoCode.use_existing_jquery()!=="undefined"?vwoCode.use_existing_jquery()?path1+"vanj"+path2:path1+"va_gq"+path2:path1+"edrv/va_gq-3adf809ea7b0629d1cfde6b0f4969635br.js"+path2;_vis_opt_lib="https://dev.visualwebsiteoptimizer.com/cdn/"+_vis_opt_file}else{_vis_opt_file=vwoCode.use_existing_jquery&&typeof vwoCode.use_existing_jquery()!=="undefined"?vwoCode.use_existing_jquery()?"edrv/vanj-7340efabe014aa7ac36a54293558de41br.js":"edrv/va_gq-3adf809ea7b0629d1cfde6b0f4969635br.js":"edrv/va_gq-3adf809ea7b0629d1cfde6b0f4969635br.js"}window._vwo_library_timer=setTimeout((function(){vwoCode.removeLoaderAndOverlay&&vwoCode.removeLoaderAndOverlay();vwoCode.finish()}),vwoCode.library_tolerance&&typeof vwoCode.library_tolerance()!=="undefined"?vwoCode.library_tolerance():2500),_vis_opt_lib=typeof _vis_opt_lib=="undefined"?window._vwo_cdn+_vis_opt_file:_vis_opt_lib;var loadLib=function(url){_vwo_code.load(url, { dSC: true, onloadCb:function(xhr,a){window._vwo_mt_l=true;if(xhr.status===200 || xhr.status===304){if(!window._vwo_wt_f)return window._vwo_mt_f=xhr.responseText;_vwo_code.addScript({text:xhr.responseText});delete window._vwo_wt_f;}else{if(gcpfb(a,loadLib,xhr.status)){return;}_vwo_code.finish("&e=loading_failure:"+a);}}, onerrorCb: function(a){if(gcpfb(a,loadLib)){return;}window._vwo_mt_l=true;_vwo_code.finish("&e=loading_failure:"+a);}})};loadLib(_vis_opt_lib);VWO.load_co=function(u,opts){return window._vwo_code.load(u,opts);};;;}}catch(e){_vwo_code.finish();_vwo_code.removeLoaderAndOverlay&&_vwo_code.removeLoaderAndOverlay();_vwo_err(e);window.VWO.caE=1}})();
COVID-19

How I read COVID-19 data: A primer from MPR News' data reporter

A cardboard sign with red tape directs people.
A sign directs people toward COVID-19 testing at the National Guard Armory in Minneapolis on Saturday.
Evan Frost | MPR News

Note: Not all the graphics in this article are updated regularly. Find the latest COVID-19 data reporting on our homepage and on the Minnesota Department of Health website.

Every day at 11 a.m., the Minnesota Department of Health releases new data on COVID-19 cases in the state. The updates can be confusing, with dozens of new points of information, missing context, and tons of questions: Which statistics are important to watch? What does the data not tell us? 

And, above all: Is this data good or bad news when it comes to the pandemic in Minnesota?

There are no easy answers to these kinds of questions. But as MPR News’ data journalist, here’s what I look at each day to understand the spread of COVID-19 in Minnesota.

The graphics in this article will update every day, so feel free to bookmark this page and use it as a dashboard.

Must-know background

There are a few important things that are crucial to know before looking at the numbers:

  • The data released was current as of 4 p.m. the day before. Each day’s 11 a.m. release covers 24 hours of data, ending at 4 p.m. the day before. So, for example, the data released at 11 a.m. on Wednesday adds cases, deaths and other information that were reported between 4 p.m. on Monday and 4 p.m. on Tuesday. 

That means the data is always one day old, and sometimes nearly two days old by the time it’s released — and that’s not even counting the time it takes after someone is tested for that test to be processed. 

  • Not everyone who has COVID-19 in Minnesota has had their diagnosis confirmed by a test. Tests remain in short supply, and some people with mild cases of the disease might not bother to get tested. 

This means a rising number of cases can be interpreted in different ways: Perhaps more people in Minnesota really have contracted COVID-19 — or perhaps Minnesota is doing a better job at testing groups of people likely to have COVID-19 — or both at once.

Metrics I watch

How fast testing is expanding, when compared to confirmed cases

Since not everyone with COVID-19, or who might have COVID-19, gets a test, then you’d expect that if Minnesota tests more people, it’ll find more cases. So rather than look only how fast cases are growing, I look at how fast cases are growing in comparison to how fast testing is growing.

It’ll be a good sign for Minnesota if the number of tests grows at a faster rate than the number of cases for a sustained period of time. As of mid-May, that hasn’t happened yet — but around the second week of May, cases stopped growing faster than tests, and both began to grow at about the same rate.
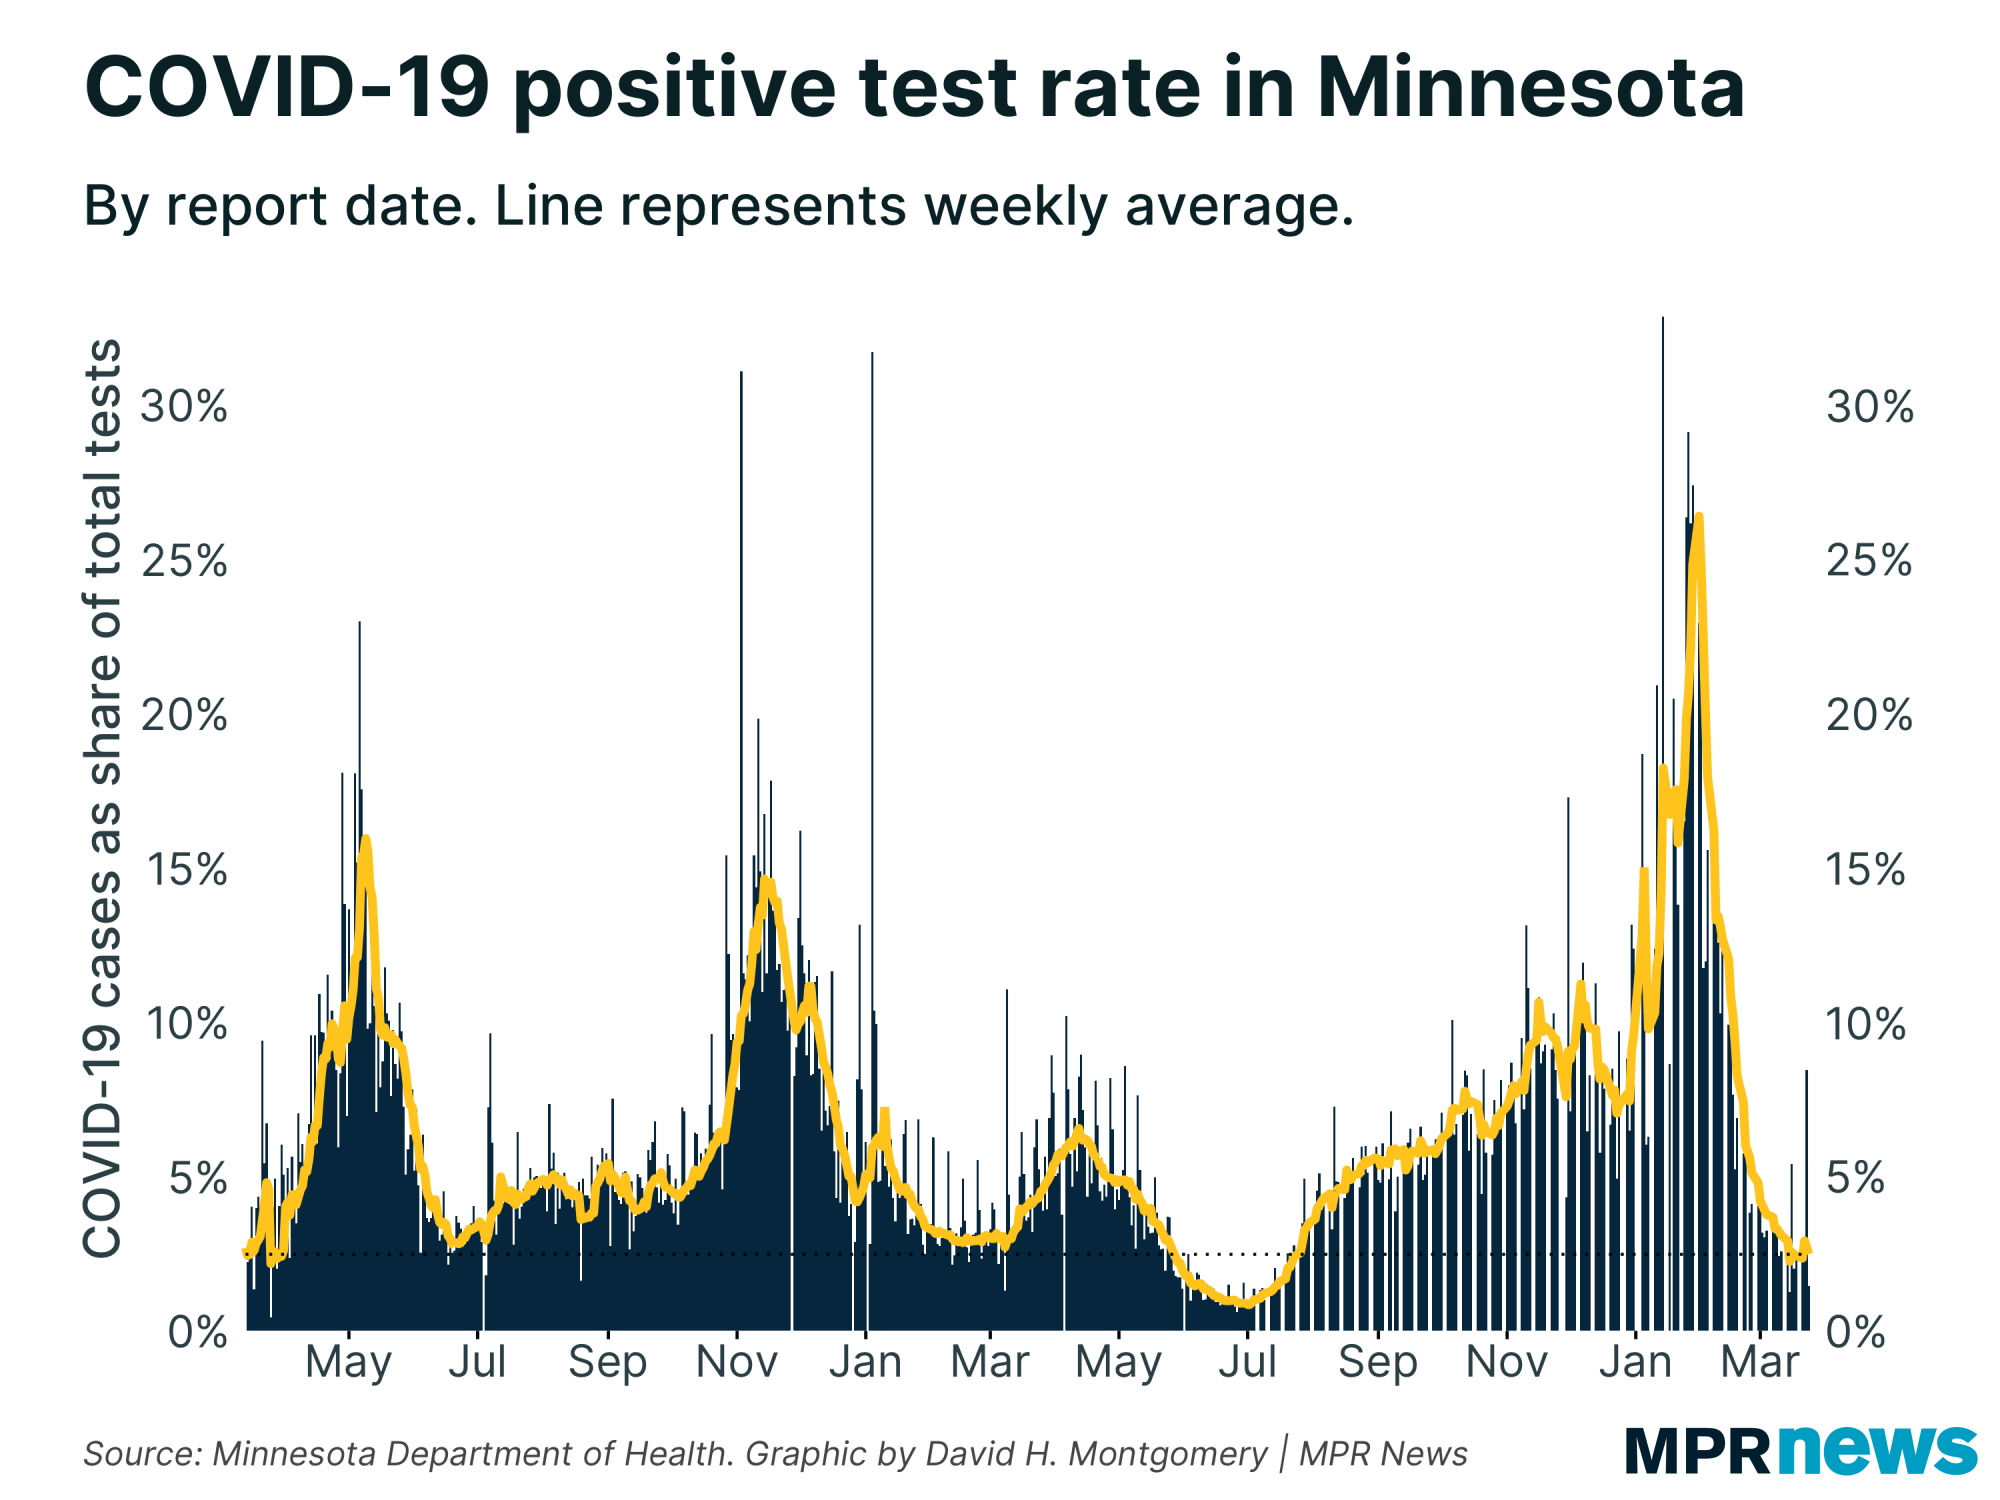
Growth of COVID-19 tests and positive cases in Minnesota.
David H. Montgomery | MPR News

Positive test rate

Another way of looking at the relationship between the number of COVID-19 tests and confirmed cases is the percent of tests that come back positive. This can capture in one metric whether the state is testing enough people — and offer a snapshot of how widespread the disease is.

If the positive rate is really high, that likely means that tests are being focused only on places that have become hot spots for the disease — or, even more of a concern, that the disease is extremely prevalent.

A low positive rate, on the other hand, is a good sign that lots of people who have reason to get tested — maybe they have flu-like symptoms, or came in contact with someone with COVID-19 — don’t have it. It’s a sign the disease isn’t spreading as quickly.

So what counts as “high” or “low”? There’s no exact number, but as NPR has reported, a good rule of thumb is that it’s a good sign if 10 percent of tests or less come back positive. That’s according to research by Harvard epidemiologist William Hanage, based on recommendations from the World Health Organization.

Minnesota was below that rate in the early part of the outbreak, but has since risen above it. After a bump in early May driven by hot spots around meatpacking plants, however, Minnesota’s positive test rate has begun a consistent decline.

It’s worth noting that because data released on individual days can be messy, I like to look at trend lines that smooth out the bumps. I’ve settled on a seven-day rolling average, which looks at the current day of data and the six prior days, and averages out the value. That way we have a full week of data, and our trend line won’t be skewed if less data gets reported on weekends, for example.

Percent of COVID-19 tests to come back positive
David H. Montgomery | MPR News

Intensive care beds

The first two metrics are helpful for tracking the prevalence of COVID-19 in the community. But what makes the disease so dangerous is the mortal threat it poses to some people who catch it. 

With many people who catch COVID-19 having mild or no symptoms, it’s important to keep tabs on how many confirmed cases get serious, too. To that end, my go-to metric is the number of COVID-19 patients in intensive care.

These numbers, generally speaking, count people with the most serious cases of COVID-19 in the state. They also represent the patients most at risk of dying from the disease. 

New York City saw a fatality rate for people on ventilators of nearly 25 percent, while the disease’s overall fatality rate is estimated at 1 to 2 percent — though not all people who have died from COVID-19 are dying in hospitals. So if this number is growing rapidly, it’s a bad sign. 

Ideally, this is declining, or at least remains flat. As before, I use a rolling average to smooth out messiness in the data.

Minnesota ICU beds used for COVID-19 patients
David H. Montgomery

Additionally, ICU beds are important to watch because they can help us understand whether Minnesota is headed toward a worst-case scenario. One of the big concerns about the COVID-19 pandemic is whether states have an intensive-care bed capacity to match the needs of patients.

The worst-case scenario is what happened in places such as northern Italy, where a swarm of cases at once overwhelmed hospital capacity, forcing doctors to ration life-saving treatments. Based on observations of the disease, many experts assume that death is all but inevitable if a COVID-19 patient needs a ventilator but can’t get one.

Given that, I compare data on ICU bed usage against the state’s ICU and ventilator capacity dashboard, to get a sense of whether Minnesota is in danger of exceeding this capacity — which, thankfully, hasn’t happened yet.

Doubling time

The first metric I watch is growth rate, for tests and cases. But what’s also telling is what that growth rate looks like over an extended period of time.

That’s where a mathematical concept called “doubling time” comes in. Doubling time looks at how long it will take a quantity to double if it keeps growing at a constant rate.

When I assess this metric, the most important thing I look for is not the actual doubling time — whether cases are doubling in 8 days versus 10 days — but the direction the line is moving. If the line on the graph below moves downward, it means the disease’s spread is accelerating. We want to see the doubling time rising, which means it takes longer for twice as many people to get sick or die from COVID-19.

Doubling time for COVID-19 cases and deaths at current rates
Days it takes for COVID-19 cases and deaths to double at current rates
David H. Montgomery | MPR News

There are several ways to calculate doubling time, depending on what figure you use for the growth rate. I use a seven-day average growth rate, to smooth out daily variance (including any effects from weekend reporting); the state Department of Health’s dashboard uses a 14-day average.

Local hot spots

Looking at statewide figures is helpful, but it’s also important to keep an eye on outbreaks on the county level, to get a better sense of what’s happening across the state. 

Minnesota has seen several local outbreaks, especially in counties with meatpacking plants, that have had a pronounced impact on those areas. Some have even grown large  enough to noticeably affect statewide positive case totals.

To better understand outbreaks, I use Minnesota’s county-by-county reporting data to look at places that are seeing rapid growth over the previous few days. 


The chart below looks at the six counties with the fastest growth in per-capita COVID-19 cases over the past three days, though there’s nothing magical about any of those parameters. I could just as easily look at the nine counties with the fastest growth in actual cases over the past five days, or any other combination. The point is to see counties that might be worth taking a closer look at.

MN counties with the fastest per-capita growth in COVID-19 cases
The six Minnesota counties with the fastest per-capita growth in COVID-19 cases
David H. Montgomery | MPR News

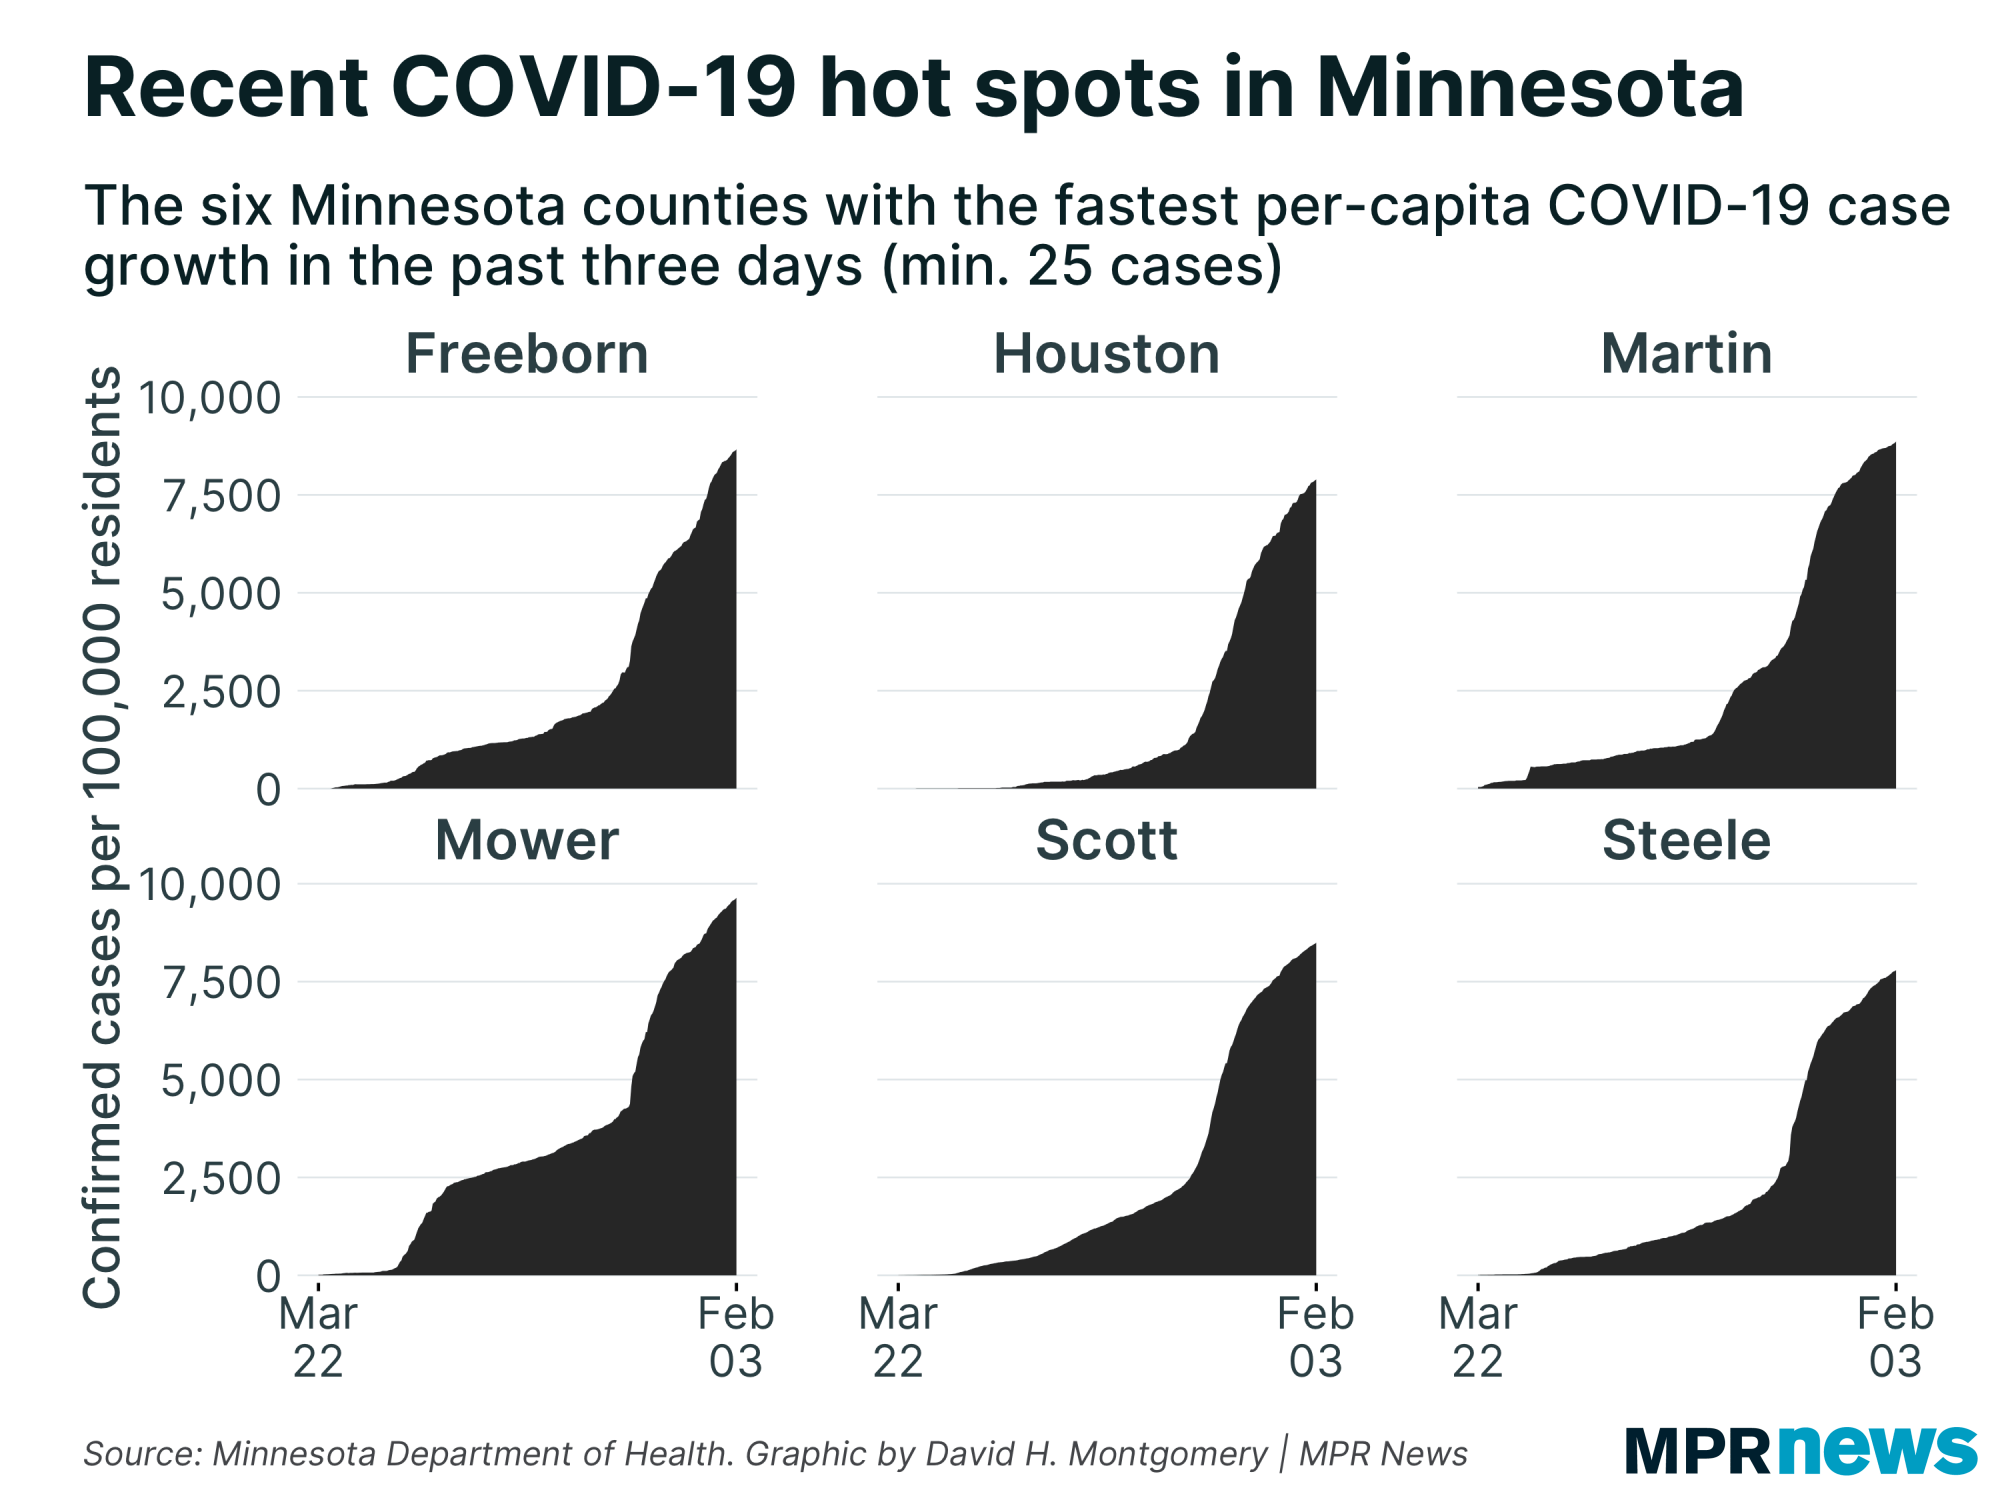
If this chart shows a county with a big uptick in cases, then that’s a sign to me that we should look into what’s happening in the county. Maybe there’s a meat-packing plant or nursing home there with a major outbreak. Perhaps that county just has more cases because there’s more testing being done, all of a sudden. 

This chart reminds me to look into local cases, and points us to specific regions that deserve more attention.

Other stats

Do you have questions about other COVID-19 metrics? Submit them with this form:

I’ll update this article regularly to answer additional questions, including charts illustrating why I think a given metric is or isn’t useful, and how it should be best interpreted.

Q. How does Minnesota compare to other states?

Audience members Amit and Mark both asked about how Minnesota's COVID-19 stats compare to other states. For that we can't rely on the Minnesota Department of Health, which only tracks data from Minnesota. Instead we can turn to the COVID Tracking Project, which gathers data from state health departments around the country.

All this should be taken with a grain of salt, because even the best state health departments have issues with reporting COVID-19 data, and combining all of them together is also combining all those separate issues. But it's the best we've got.

As I described earlier in this article, no one stat can give you a full picture of the disease — and some of the metrics I used earlier (such as percentage growth in cases vs. tests) are too messy for a big-picture comparison between states, especially with data quality issues between states. I try to compare states in a bunch of different ways, more than I can show here, though I may do a follow-up article explaining in more detail the best way to use data to compare states' outbreaks. One relatively simple way to look at the data is to use the percentage growth rates of COVID-19 cases and deaths, which you can see below. As before, I use a seven-day rolling average to smooth out trends.

COVID-19 case growth in Minnesota vs. other states
David H. Montgomery | MPR News
Growth of COVID-19 deaths in Minnesota vs. other states
David H. Montgomery | MPR News

One inevitable tradeoff with this kind of graphs is showing the full history of the outbreak vs. capturing the present moment. Early on in an outbreak percent growth rates tend to be much higher, so including the early stages expands the y-axis scale and makes it harder to discern the smaller differences between states later in the epidemic. For now I've compromised by using an April 1 cutoff date, eliminating the early stages of the outbreak where growth rates regularly approached or exceeded 100 percent, but there's no perfect solution here.

You might also find the charts I update regularly comparing the COVID-19 outbreak in Minnesota and its neighbors helpful.

Volume Button
Volume
Now Listening To Livestream
MPR News logo
On Air
BBC World Service