Wastewater is king to understanding COVID infections in Minnesota
Hospital data is also helpful when understanding this phase of the pandemic

Go Deeper.
Create an account or log in to save stories.
Like this?
Thanks for liking this story! We have added it to a list of your favorite stories.
Three Things to know
Positivity rate is positively gone.
Cases are inching up, as is the viral load in the Twin Cities wastewater, but it’s still too soon to tell if it’s the start of a new major wave.
Minnesota’s Indigenous population has been hit hard in last six months compared to other race and ethnicity groups.
On April 4 the federal government stopped requiring labs to report negative test results. With prior concerns of the usefulness of positivity rates and an increase in at-home testing, the Minnesota Department of Health decided to stop publishing positivity rates. Wastewater data provides another option for early warning of rising cases and its use could go beyond the Twin Cities metro.
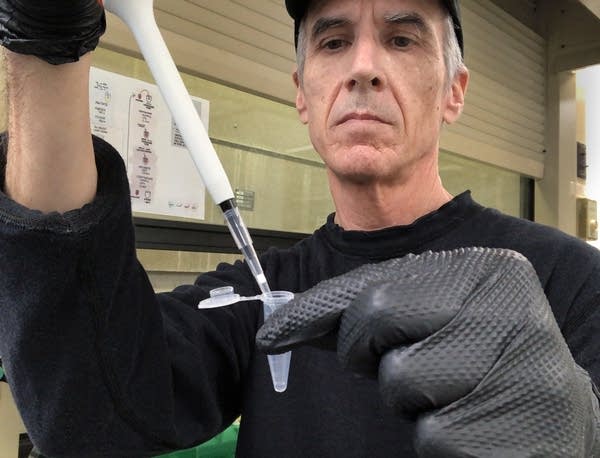
According to the wastewater data, omicron BA.2 is closing in as the dominant strain for Minnesotans. In addition, the prevalence of COVID-19 in Twin Cities wastewater is increasing, up by more than 50% over last week's measurement.

COVID trends in metro wastewater correlate with the uptick in statewide COVID cases. Reports from earlier this week have case counts topping 570, up from 440 the week before. This compares to a recent low point of 373 cases on March 20 and case counts above 10,000 for much of January.
Non-ICU admissions are low and stable, while ICU admissions are low but have increased a bit.
Indigenous Americans have seen higher mortality rates from COVID-19. Indigenous Minnesotans have also had the highest crude mortality rates of any group. What we know for Minnesota says the cumulative rates have gone up 390 per 100,000 for Indigenous Minnesotans and to 447 per 100,000 for Indigenous Americans as a whole.
Turn Up Your Support
MPR News helps you turn down the noise and build shared understanding. Turn up your support for this public resource and keep trusted journalism accessible to all.


