Official case reports suggest low COVID circulation in MN, but some readers report much more

Go Deeper.
Create an account or log in to save stories.
Like this?
Thanks for liking this story! We have added it to a list of your favorite stories.
Thanks to the 313 of you who participated in our reader survey last week. We find it valuable to have insight into what our readers are experiencing, even if the results don't carry the same weight as those from a proper, randomly sampled poll.
So, what did you report? With the caveat that there’s probably some bias of people with ‘yes’ answers being more likely to fill out the survey, 75 percent of respondents said they had heard about a lot of COVID going around the past couple of weeks. Forty-four percent said that it seems like more people have it now than at any time in the past year.
A few common themes came up in responses. A little over 10 percent mentioned they had it for the first time recently or knew of people who had. This included a number of people who said they always mask in public and hadn’t changed their behavior recently. Of those who mentioned the severity of their symptoms, almost all said that recent cases were relatively mild. Although a few readers said it was worse than the flu, or that it lingered for weeks.
Several readers mentioned that long-term care facilities in their communities have recently been enacting restrictions again, even quarantining floors.
Turn Up Your Support
MPR News helps you turn down the noise and build shared understanding. Turn up your support for this public resource and keep trusted journalism accessible to all.
Nonetheless, about one-quarter of respondents said they are not seeing many COVID cases right now. And sometimes opposite reports came from people in the same town. One person said they don’t know a single person in their extensive networks with COVID, while another person from the same place said that nearly every household they know has someone with COVID.
How does this admittedly unscientific survey compare to other sources of COVID information? One more robust source we’ve been looking at – the Household Pulse Survey from the U.S. Census – suggests that more people have been getting COVID for the first time in the last couple of months compared to the fall. (We’ll include a more detailed look at this data when the new results are released in a couple of weeks.)
On the other hand, officially reported cases have stayed relatively stable and low in recent months. Official case data mainly comes from tests reported by health care providers. So as at-home testing has become more prevalent, and as, perhaps, people are experiencing more mild cases and are less likely to seek care from a provider, drawing conclusions from case data seems to be less and less reliable.
Before at-home testing became widely available, case rates and wastewater were closely correlated in the Twin Cities, suggesting that wastewater was a fairly good indicator of COVID circulation in the community. While COVID load in wastewater is well below what we’ve seen during surging periods, it’s still been more elevated lately than it was for much of 2021. For what it’s worth, that tracks more with our reader survey results than the officially reported cases.
Taken all together, it looks like COVID is still circulating fairly significantly in communities, but with far less people going to the hospital or dying directly from the disease.
We detail the latest Minnesota COVID data below, but word of mouth may be one of the best indicators for COVID in your immediate circles. If you get a positive test, let people you’ve had contact with know so that they can test and try to limit further spread.
Cases, hospitalizations and deaths remain relatively unchanged since last week
According to officially reported data this week, cases in many regions of Minnesota are similar to the previous week. There is one exception – after rising for several weeks, cases went down in the southwest part of the state. And cases are up a bit in west central, northwest and southeast Minnesota. As touched on above, take this data with a grain of salt. If cases are level or going down in your region, that doesn’t necessarily mean your area is COVID-free, because cases not reported through a healthcare provider aren’t counted. But, if cases are going up in your region, that’s a more solid indication that COVID is likely causing more symptomatic cases in your area.

Both intensive care unit and non-ICU hospitalizations stayed about the same as a week ago.

While not quite as low as the dip we saw last March and April, these continue to be the lowest number of hospitalizations we’ve seen since last spring. COVID hospital admissions are currently averaging around 50 per day.

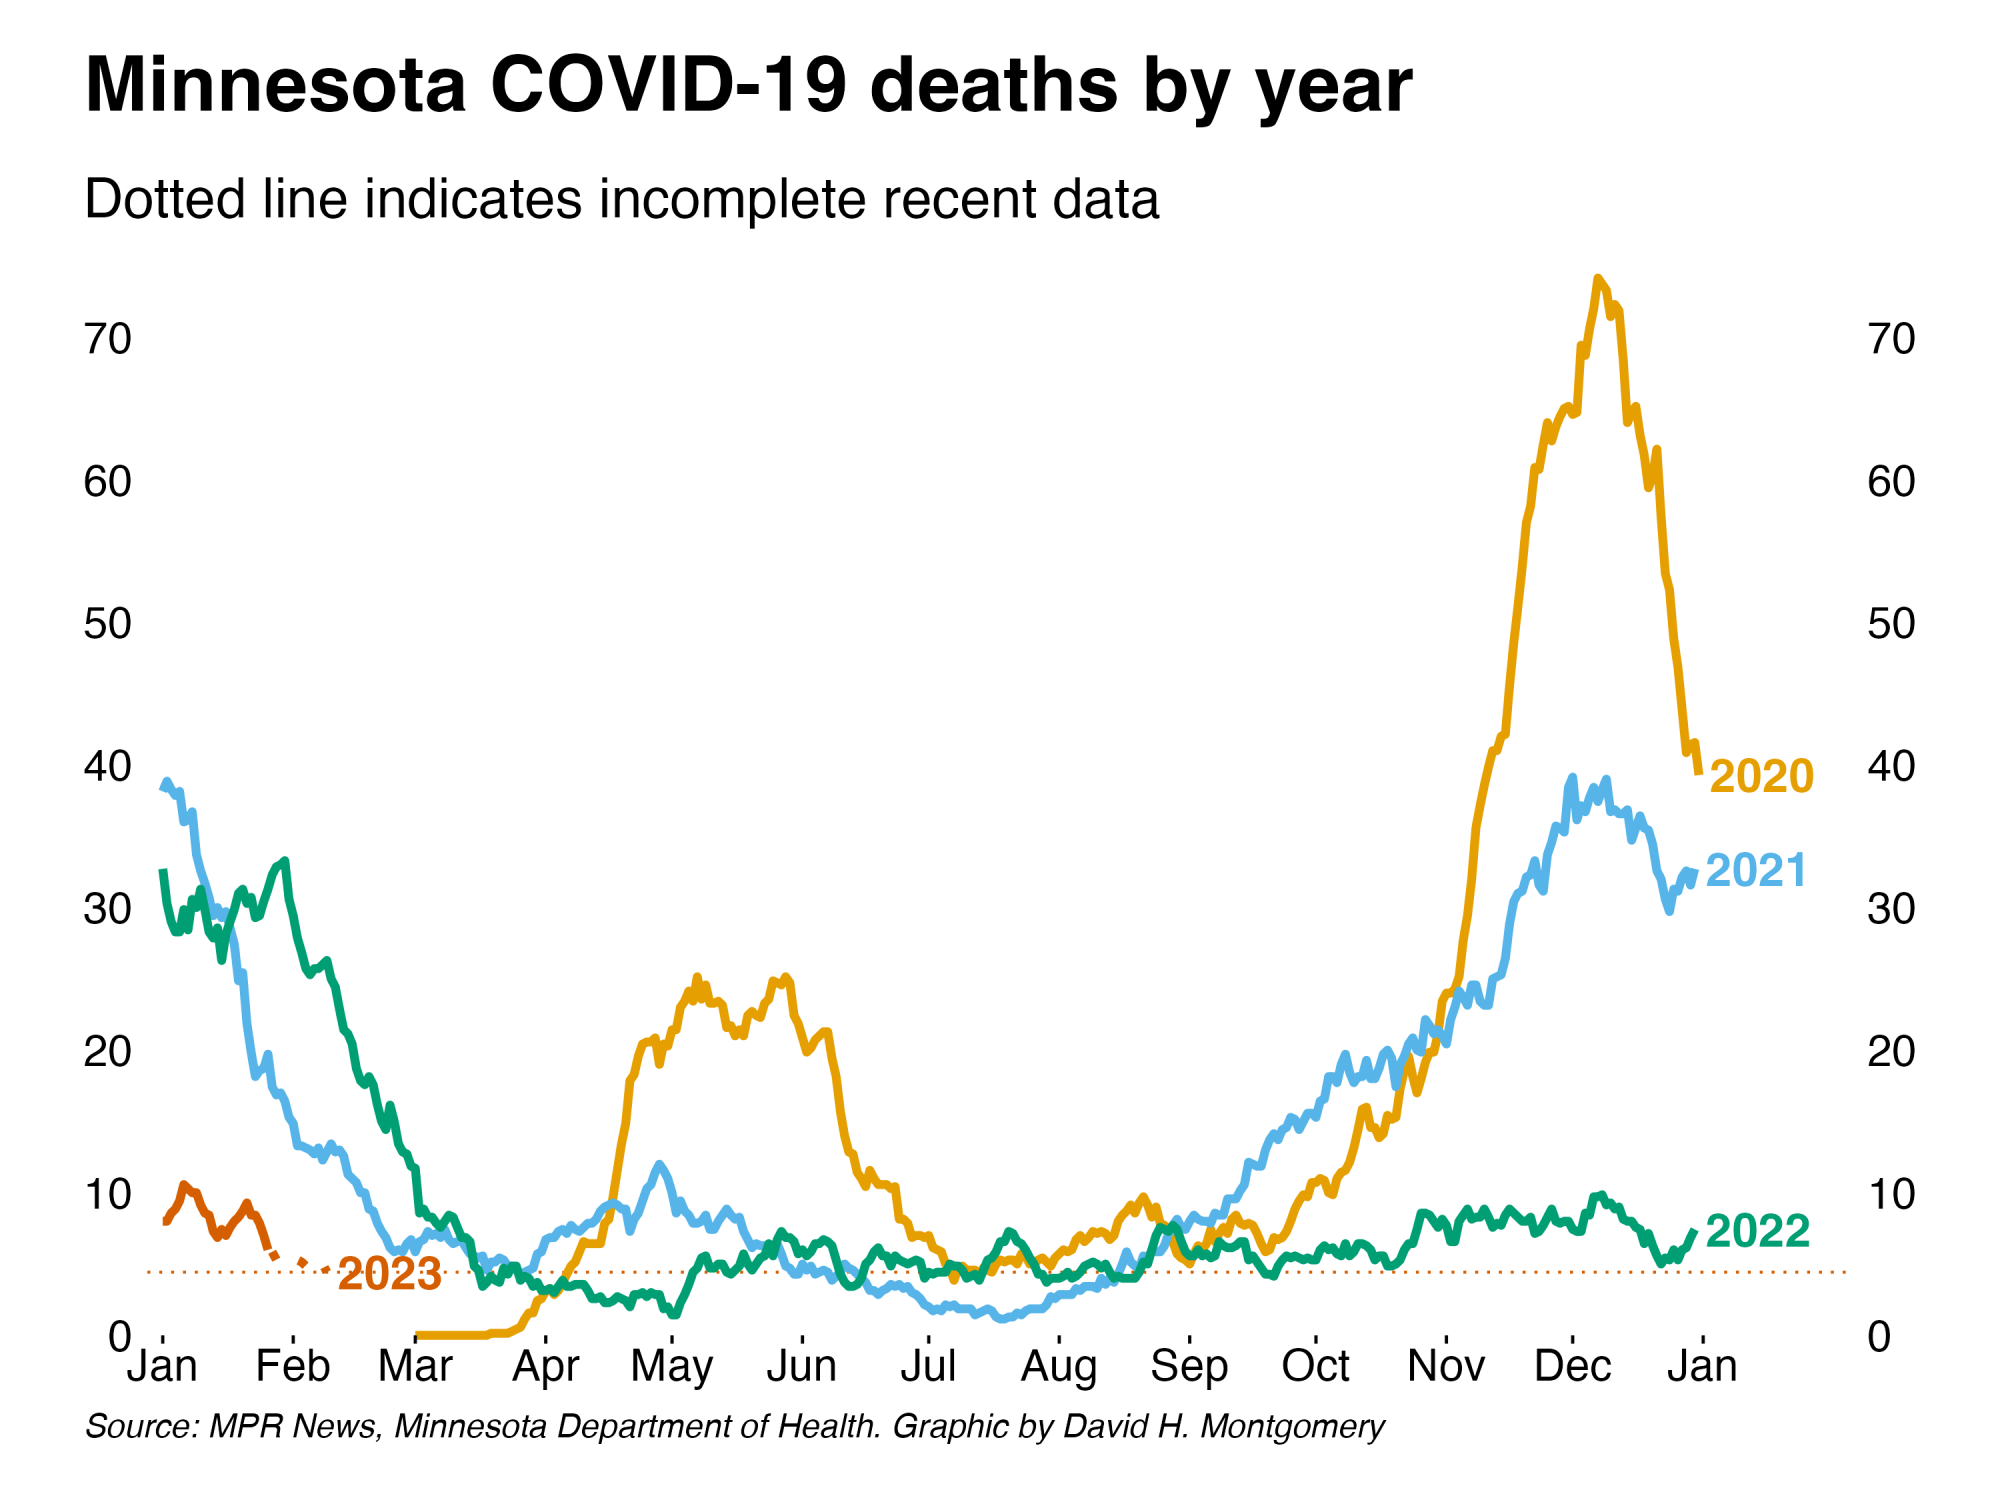
There was another uptick of COVID deaths in late January, but since then fewer deaths have been reported.

COVID wastewater data shows increased levels in many parts of the state
Twin Cities metro update
The total level of virus decreased by 13 percent last week compared to the previous week, according to the latest data from the Metropolitan Council and the University of Minnesota’s Genomic Center. Although the level of COVID-19 decreased this week and is lower than the level at the start of February, the level is still higher than where we were at this time in 2021 and 2022.

XBB, a sublineage of BA.2, continues to be the dominant variant detected in the viral RNA load entering the Metro Plant. This week it comprised 77 percent of the viral load, up from 71 percent last week. The vast majority of the other samples (17 percent) were identified as BQ.1, a subvariant of BQ.5.
Statewide update
COVID levels in wastewater increased throughout much of the state, according to the latest data out of the University of Minnesota’s Wastewater SARS-CoV2 Surveillance Study. For the period ending on Feb. 5, only the study’s North East region saw four-week and one-week declines. The South Central and South East regions saw modest four-week decreases in COVID levels but increases in those levels over the prior week.
The study’s Central and South West regions saw the largest four-week increases of 127 percent and 103 percent, respectively. The North West region saw the largest increase over the prior week at 98 percent. The Twin Cities metro experienced a four-week increase of 18 percent and a one-week increase of 12 percent. (This data lags the Met Council’s by a week, which results in the discrepancy between the two data sources for the Metro.)
In an email communication to the APM Research Lab, the Minnesota Department of Health reports that, when it comes to sequencing case samples from across the state, “Omicron XBB lineages continue to show increases in our percentage of sequenced specimens, while BA.5 lineages appear on the cusp of losing their more than six-month dominance of the variant mix in Minnesota.” For the latest two-week reporting period ending on Jan. 28, “XBB lineages comprised 44 percent of sequenced specimens” in Minnesota, “compared to 19 percent in the last period.”
CDC ups the number of high-risk counties, while much of state remains low risk
The map of Minnesota has more orange counties indicating “high risk” this week than at any other time since early September, according to the latest Centers for Disease Control and Prevention’s “Community Level” COVID-19 assessments. Six counties are rated high risk this week: Kanabec, Pope, Houston, Clearwater, Douglas and Stevens County. Last week, only Pope County was rated as high risk.
The last time there were as many as six high-risk counties was in the assessments released on Sept. 1. Between then and now, there have been three weeks when the CDC rated five Minnesota counties as high risk. The most recent of those instances was on Dec. 8.
Although the number of high-risk counties is higher, and people in those counties should take extra precautions, the overall map of Minnesota remains very green. Only 11 counties are rated medium risk this week. While that number is four more than last week, it is still roughly one-third the number of medium-risk counties in early- and mid-January.
Given that other metrics show a relatively stable situation throughout the state, what is driving this uptick in high-risk counties? Four of the six high-risk counties — Kanabec, Pope, Houston and Clearwater — have case rates of 200 per 100,000 people or more and a rate of new COVID-19 hospital admissions of 10 or more per 100,000, which meets the CDC’s criteria for high risk. The two other counties, Douglas and Stevens, have a case rate that is fewer than 200 per 100,000, but they each have a COVID-19 hospital admissions rate of 20 per 100,000, which is the other criteria for the CDC to rate a county as high risk. (You can see the full set of criteria from the CDC here and the maps showing case rates and hospital admission rates on our website.)
Because these case rates and hospitalization rates remain localized to the handful of relatively low-population counties rated high risk this week, they have not had a large impact on state-wide trends.
This week 35 counties have case rates that meet the CDC’s definition of high transmission (weekly case rates of 100 or more cases per 100,000), a 46 percent increase from the number last week. This is the largest number of counties that meet this threshold in the last month. Nobles, Kanabec, Pope, Yellow Medicine, Watonwan, Houston and Clearwater counties have a weekly case rate that exceeds 200 per 100,000. Nobles, Pope and Yellow Medicine counties met this threshold last week.
Forty-six counties meet the CDC’s definition of “substantial” transmission (weekly case rates of 50-99.9 per 100,000) this week. This number has remained relatively stable over the last six weeks.
Dear reader,
The trustworthy and factual news you find here at MPR News relies on the generosity of readers like you.
Your donation ensures that our journalism remains available to all, connecting communities and facilitating better conversations for everyone.
Will you make a gift today to help keep this trusted new source accessible to all?


